How to Perform a Simple Machine Search with the CrowdStrike Falcon® Investigate App
Thank you for joining us. Today we’re going to show you how you can easily search from a historic perspective in the CrowdStrike Falcon® user interface. As you can see on the left hand side, I have chosen my investigate tab. From here, I can search for computer, source IP, hash, user– across my entire set of data in the cloud without ever touching one single endpoint.
I’m going to choose computer and insert a computer name that I know exists on my network. I can search as far back as 30 days in the cloud, but I’m going to choose seven days. I hit submit, and when I do we are only searching in the cloud. We are not reaching out to this endpoint and interacting with it in real time in any way.
The beauty of the Falcon sensor is all data is recorded on the endpoint from an activity perspective and sent out to our cloud to be stored and aggregated. So here I could see that the machine was last on my network on this date– this was the last time it was rebooted– the CrowdStrike sensor version that’s installed, IP information, and basic hardware.
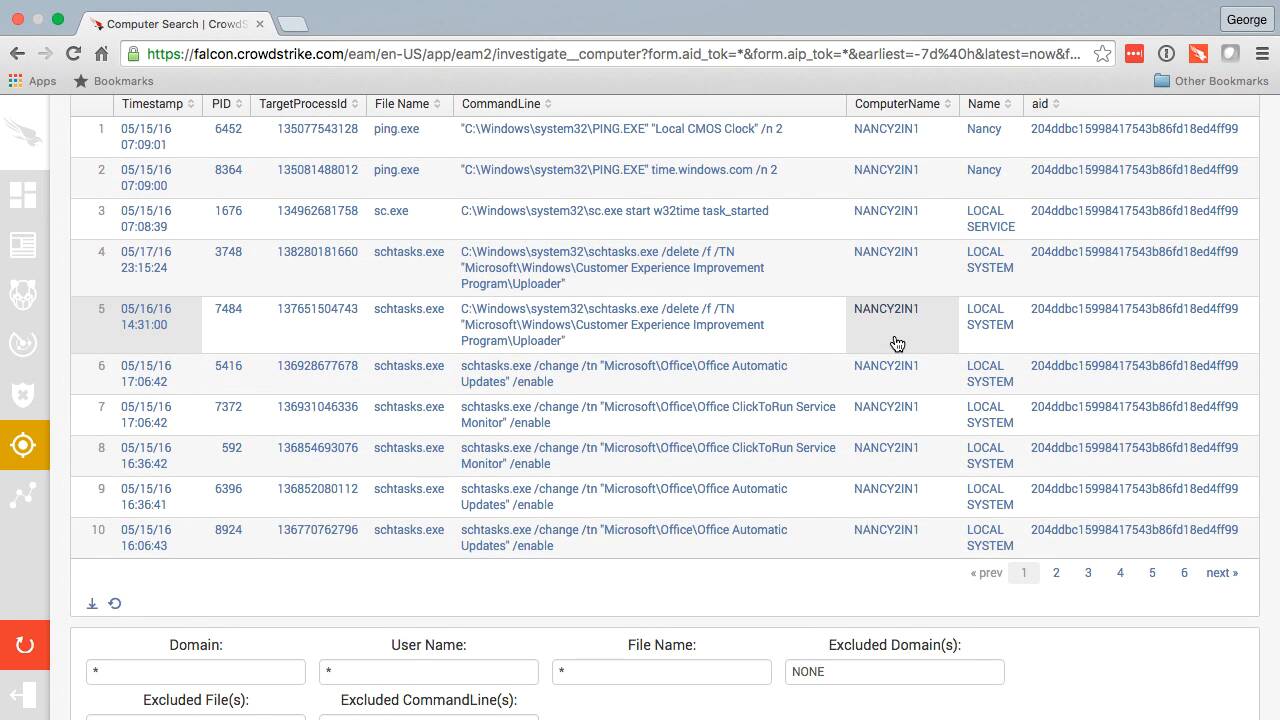
I could also see all external network connections as of one minute ago for the last seven days. Total event count, local and external IPs, unique users that have logged on in the last seven days, and some additional summary data. Here we can see every single process execution on that machine for the last seven days.
As you can see, we’re only showing 10 results at a time, but there are additional pages to scroll through. I could filter right in this interface if I chose to. So I could exclude certain command lines, I could only include certain users, file names, or exclude certain files all from the same summary screen. If we scroll down further, we see all admin tool usage on that machine. This is typical commands that might be executed from the Windows system folder or other secret commands that may often go unnoticed on a typical machine.
Here, we see every single DNS request from a per process perspective. That means every process that executed a DNS look-up can be found here. Also great information when you’re searching through an incident. These are network connections that are active in real time and historic. So I can see every MD5 hash, command line, and associated user with it.
Here, we see network listening ports. These are all ports that are listening over the last seven days. As you can see here, we see the file name, MD5 hash, and the command line that started that network listening process on that endpoint. Here are any zip files or RAR files have been written on that endpoint and any scripts that were executed on that machine.
Below, we see additional executable activities. And finally, any scheduled tasks that were created on that machine. All this is considered summary data because we search for machine, not something very specific. From here, we can easily pivot by choosing any one of these linkable activities. For example, I will choose this command line. If I drill down on that, we open up a new window and dive even further into the events tab, which gives us raw data on that very specific command line.
Here, we can see additional deeper or more raw information about that event. And if I see something interesting, such as an MD5 hash or a command line that was executed, I could pivot further without having to load complex queries or searches. I could say, show me the process that was responsible for this event, for example. If I do that, I can pivot even further off of that next event. So pivoting is very easy when you are searching or performing an incident research activity across Falcon.
