How to Complete Your LogScale Observability Strategy with Grafana

CrowdStrike Falcon® LogScale provides a full range of dashboarding and live query capabilities out of the box. Sometimes, however, you’ll work in an environment where there are other solutions alongside LogScale. For example, let’s say your operations team takes an observability approach that includes metrics scraped by Prometheus, tracing with Tempo and dashboard visualizations with Grafana. LogScale may just be one part of a wider strategy, but integrating LogScale into Grafana is simple!
When Falcon LogScale and Grafana come together, they empower organizations to visualize their logs and traces from one user interface, thereby reducing complexity while giving you the scale and performance needed to store data for as long as you need it.
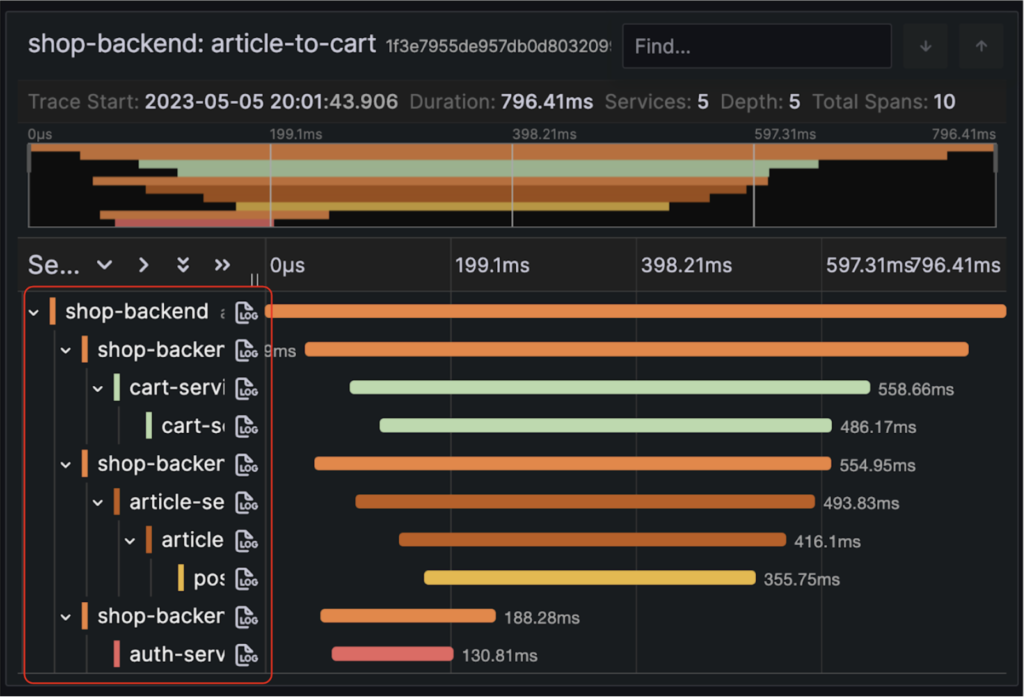
Tracing makes debugging and understanding distributed systems less daunting by breaking down what happens within a request as it flows through a distributed system. With traces, you can quickly pinpoint the source of the issue and identify which trace logs to focus on.
The LogScale data source plugin for Grafana allows you to easily ingest trace logs into LogScale, which can then be instrumented by popular open-source tracing solutions such as Zipkin, Jaeger and Tempo. The visualization of the traces are then available in Grafana, providing a complete picture of logs and traces.
Combine Logs and Traces using Falcon LogScale and Grafana
Before we show how to link up LogScale with Grafana, we’ll assume you’ve met the following two prerequisites:
- You have a LogScale instance up and running, whether that’s a self-hosted deployment or a Cloud version, or an instance of Falcon LogScale Community Edition running on LogScale Cloud.
- You have a repository in your LogScale instance with data in it.
For this demo, we’ll use:
- A Falcon LogScale Community Edition license
- The grafana/grafana source image from Dockerhub
- A LogScale repository setup with web server log data
Ready? Let’s roll.
Step 1: Install the Falcon LogScale Data Source Plugin
The key connector that facilitates this integration between LogScale and Grafana is the LogScale data source plugin for Grafana. We recommend running Grafana 8.4.7 or higher.
First, we’ll cover the steps for setting up the plugin as if you were running Grafana natively on an operating system. If you’re following along just to test out the plugin or want to get up and running sooner, jump ahead to the Containerized Quickstart section below.
Installing and configuring Grafana is outside of the scope of this demo. We’ve already installed Grafana using our package manager. Doing so gives us a grafana-cli utility which we can use to install the Falcon LogScale data source plugin.
$ sudo grafana-cli plugins install grafana-falconlogscale-datasource

$ sudo systemctl restart grafana-server.service
That’s it!
Now, when you navigate in the Grafana interface to Administration > Plugins, you’ll see the data source plugin installed!
Containerized Quickstart
Clone Grafana Tempo. It’s a distributed tracing system which integrates Tempo traces with Grafana in just a few steps.
git clone https://github.com/grafana/tempo
If you want to have the LogScale plugin installed automatically during Grafana startup, edit the Docker compose file and add GF_INSTALL_PLUGINS=grafana-falconlogscale-datasource as an environment variable under the Grafana service.
The Docker compose file is located under tempo/example/docker-compose/local/
version: "3"
services:

  tempo:
    image: grafana/tempo:latest
    command: [ "-config.file=/etc/tempo.yaml" ]
    volumes:
      - ../shared/tempo.yaml:/etc/tempo.yaml
      - ./tempo-data:/tmp/tempo
    ports:
      - "14268:14268"  # jaeger ingest
      - "3200:3200"   # tempo
      - "9095:9095" # tempo grpc
      - "4317:4317"  # otlp grpc
      - "4318:4318"  # otlp http
      - "9411:9411"   # zipkin

  k6-tracing:
    image: ghcr.io/grafana/xk6-client-tracing:v0.0.2
    environment:
      - ENDPOINT=tempo:4317
    restart: always
    depends_on:
      - tempo

  prometheus:
    image: prom/prometheus:latest
    command:
      - --config.file=/etc/prometheus.yaml
      - --web.enable-remote-write-receiver
      - --enable-feature=exemplar-storage
    volumes:
      - ../shared/prometheus.yaml:/etc/prometheus.yaml
    ports:
      - "9090:9090"

  grafana:
    image: grafana/grafana:9.4.3
    volumes:
      - ../shared/grafana-datasources.yaml:/etc/grafana/provisioning/datasources/datasources.yaml
    environment:
      - GF_AUTH_ANONYMOUS_ENABLED=true
      - GF_AUTH_ANONYMOUS_ORG_ROLE=Admin
      - GF_AUTH_DISABLE_LOGIN_FORM=true
      - GF_FEATURE_TOGGLES_ENABLE=traceqlEditor
      - GF_INSTALL_PLUGINS=grafana-falconlogscale-datasource
    ports:
      - "3000:3000"
Grafana also has a handy option that automatically installs the Falcon LogScale data source plugin when running a container.
Note: if you want to preserve your configuration during the container restarts, add ./grafana-data:/var/lib/grafana to the volumes section of the Grafana service.
Now, run the following command for a ready-to-use Grafana instance with the Falcon LogScale data source plugin installed.
$ cd tempo/example/docker-compose/local
$ docker-compose -f docker-compose.yaml up -d
This command automates the installation of a local Grafana stack. The Grafana interface is now available at https://cs-staging-2-www.crowdstrike.com:3000 in your browser.
For a quick sanity check, let’s make sure our local container stack is running.
$ docker-compose -f docker-compose.yaml ps

Now that Grafana is up and running, navigate to https://cs-staging-2-www.crowdstrike.com:3000 in your browser and log in. The container doesn’t need a specific authentication scheme; simply enter “admin” for username and password on the login page.
When you navigate to Administration > Plugins and search for Falcon LogScale, you’ll see the plugin installed.

Step 2: Configure the Falcon LogScale Data Source
Now we can review our data sources. The LogScale data source may require further edits for multiple clusters. For this demo, Tempo is already populated with some traces, which we’ll correlate with LogScale events later in the post.
From the menu, navigate to Connections > Your connections > Data sources to confirm that the Falcon LogScale plugin was installed by the Docker script. Edit the configurations as needed.
If the plugin is not installed, navigate to Administration > Plugins, search for Falcon LogScale and click it. There, you’ll see documentation about the plugin, but we’re interested in the button to Create a Falcon LogScale data source. Click it to proceed to the data source configuration.

Although there’s a lot of information on the configuration page, we’ll focus on the most important settings. First, the name of the data source is prepopulated with Falcon LogScale, but you can change this if you’d like. For our demo, we’ll continue with the default name.

Second, the connection URL will vary depending on your LogScale environment and license. We’re using Falcon LogScale Community Edition, so our URL is https://cloud.community.humio.com . For Falcon LogScale Cloud customers, change the URL to point to your LogScale instance, for example https://cloud.us.humio.com/. You can consult LogScale’s endpoints documentation for the URL you should use.

Finally, we need to configure authentication. Grafana needs some sort of credential or token to authenticate with LogScale to access repository data. There are several settings you can use to meet the needs of your environment. For ease of configuration, we’ll use a personal API token and add it to the last box shown here:
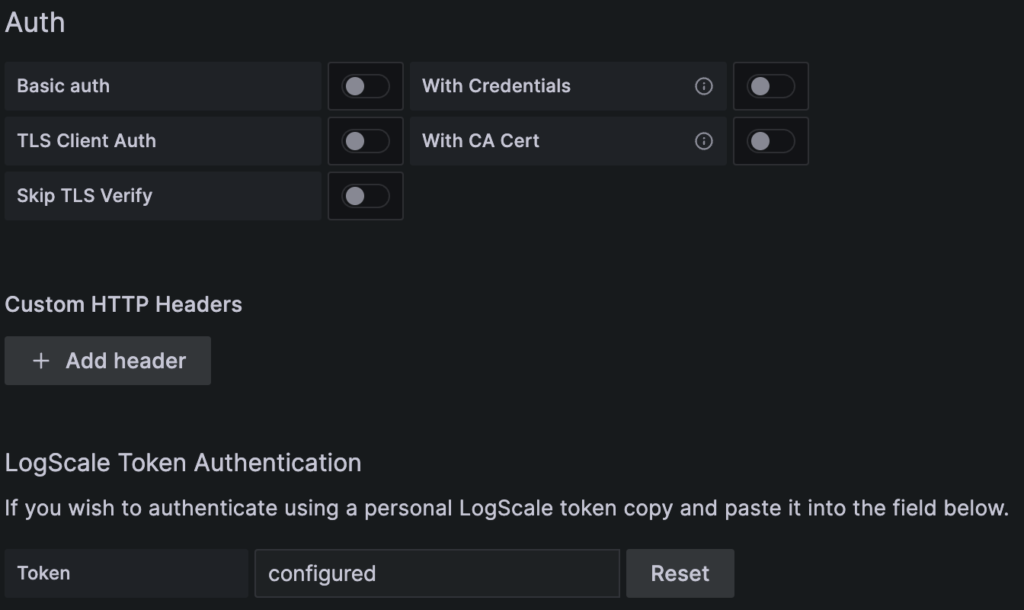
Note: If you’re actively using your personal API token for other use cases, resetting it will impact any other application using it!
To generate a personal access token, log in to LogScale and navigate to User Menu > Manage your account > Personal API Token. Then, set or reset your token. Once you have your token, you can copy its value and paste it into the Grafana “Token” box pictured above.
To correlate traces with the logs, configure the “Data Links” and set the “Field” values that match the field names extracted from your logs. Here, we set it to trace_ID and #type and add ${__value.raw} as the query that points to the internal Tempo integration.
Click Save & test to verify connectivity.
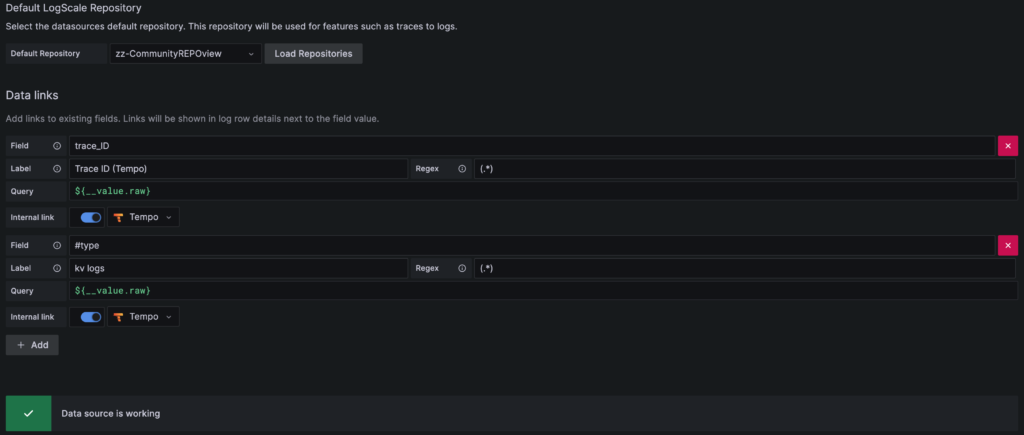
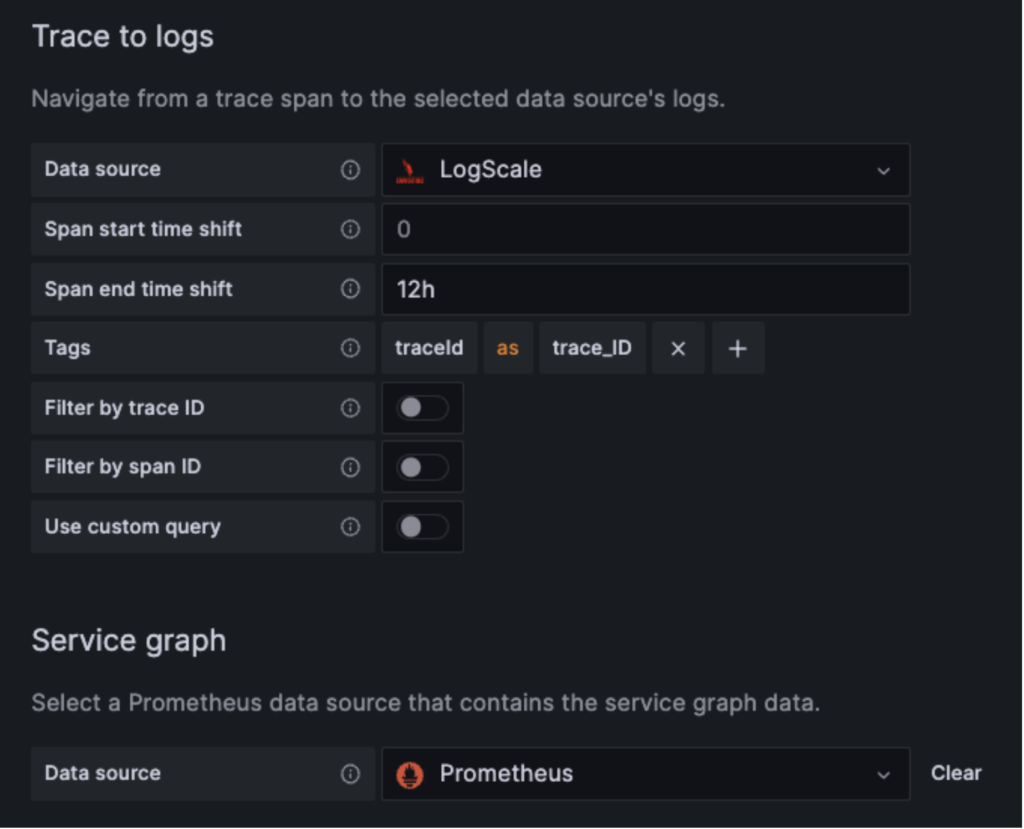
The last step is to configure the Tempo data source and link the traces with LogScale. Navigate to Connections > Your connections > Data sources and select Tempo.
Ensure these configurations in your environment:
- Select LogScale as a data source and set the time spans for your traces.
- Define a tag and ensure they match with the LogScale fields.
- Optionally, you can use a custom query to limit the events returned from LogScale.
Here’s an example screenshot with basic configurations.
Step 3: Run Queries and Configure Dashboards
Running queries on LogScale data in Grafana works like querying directly in LogScale. For example, taking our demo repository with web server data, we can run a time chart in Grafana the same way we would do it in LogScale. We navigate to the Explore section of Grafana, select our repository and run the query.
#type=kv | timeChart()
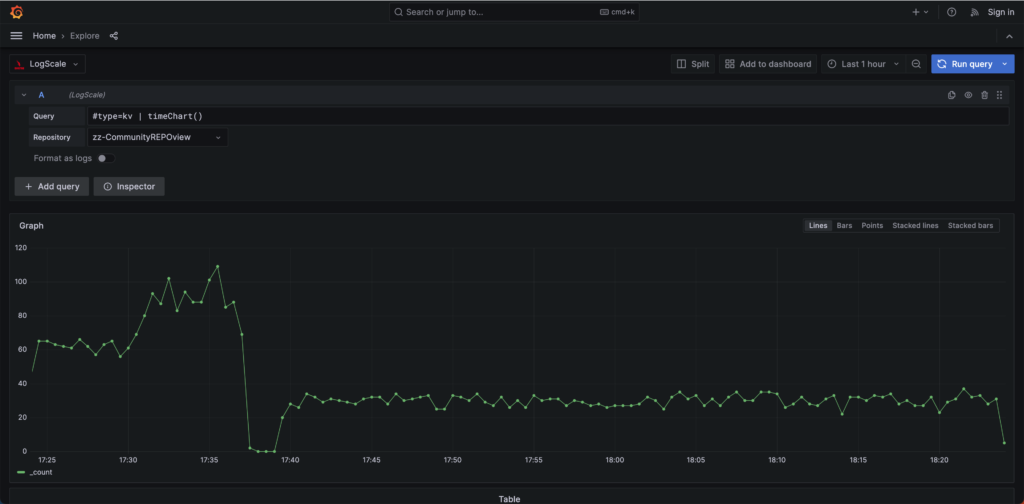
The Grafana Integrations page in the LogScale documentation has some tips on how certain outputs of LogScale map to Grafana.
Queries can get rather long, especially in complex use cases. Fortunately, LogScale lets you save queries, and the Falcon LogScale data source plugin lets you use those saved queries directly in Grafana!
Let’s start with our example query from above:
#type=kv | timeChart()
Save this query in the LogScale interface as “WebServer_timechart”.
Now you can go back to the query input in Grafana and reference the saved query as $WebServer_timechart()
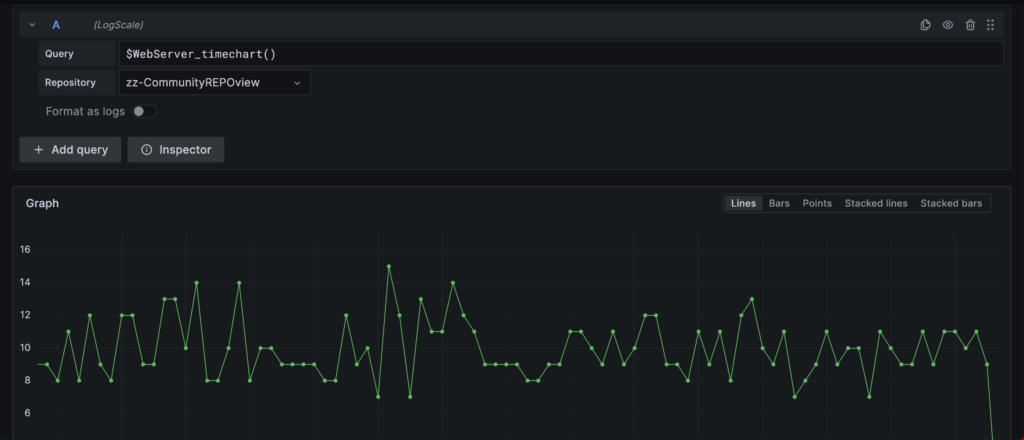
When we use our saved query, everything looks the same, so we consider that a success!
Now that we have a baseline for what a Grafana panel looks like, we can put this together with other data sources into a single dashboard, effectively completing our observability strategy using LogScale as a key piece of the puzzle.
Here’s an example of viewing LogScale logs with other data sources.
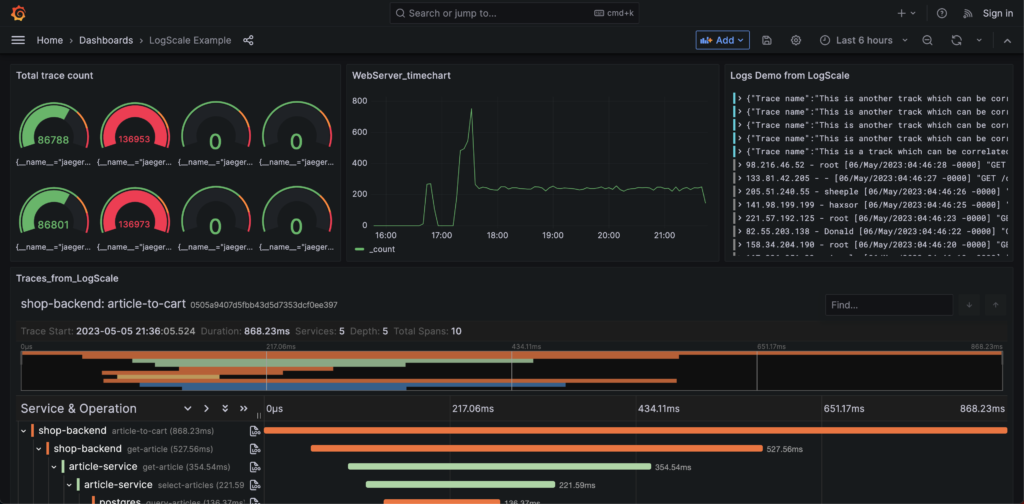
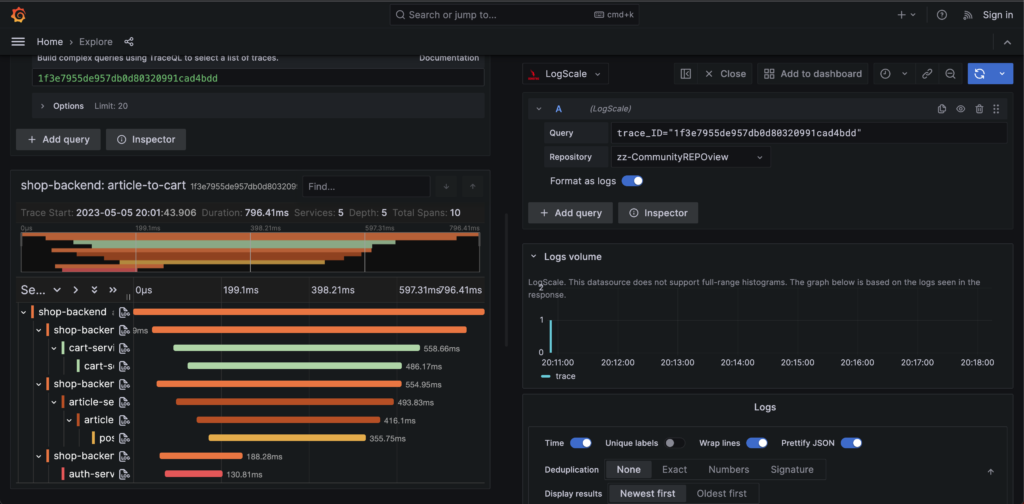
The above dashboards provide an overview of the correlated LogScale events with the traces.
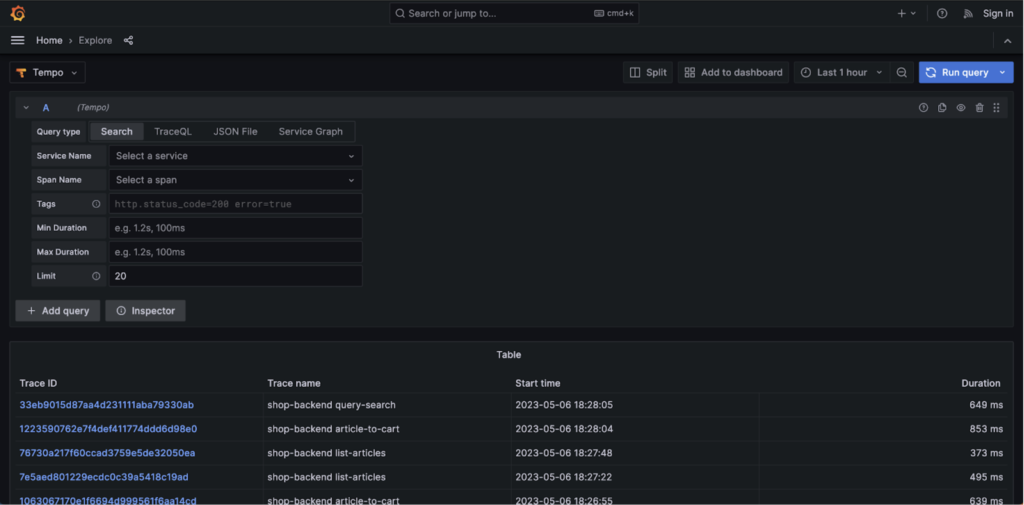
We copied a few trace IDs from the Tempo search output and replaced it with the <TRACE_ID> in the curl command.
curl https://cloud.community.humio.com/api/v1/ingest/json \
-X POST \
-H "Authorization: Bearer <INGEST_TOKEN>" \
-H "Content-Type: application/json" \
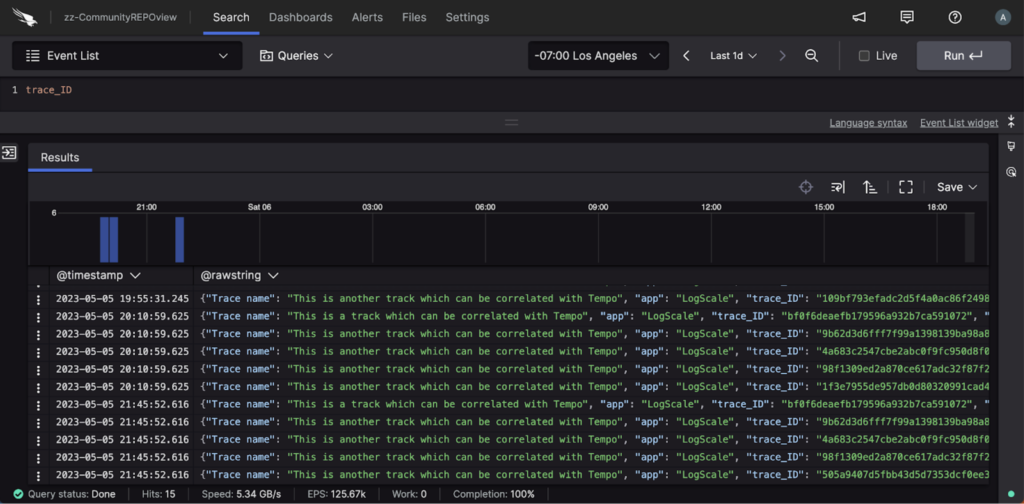
-d '[{"trace_ID": "<TRACE_ID>", "Trace name": "This is a track which can be correlated with Tempo", "user": "myuser", "app": "HelloWorld app"},{"trace_ID": "<TRACE_ID>", "Trace name": "This is another track which can be correlated with Tempo", "user": "myuser", "app": "HelloWorld app"}]'
Remember to set a valid ingest token. If you’re not using the Community cluster, specify the correct URL and direct the events to your LogScale environment. The events can be visualized in your LogScale instance, as seen below.
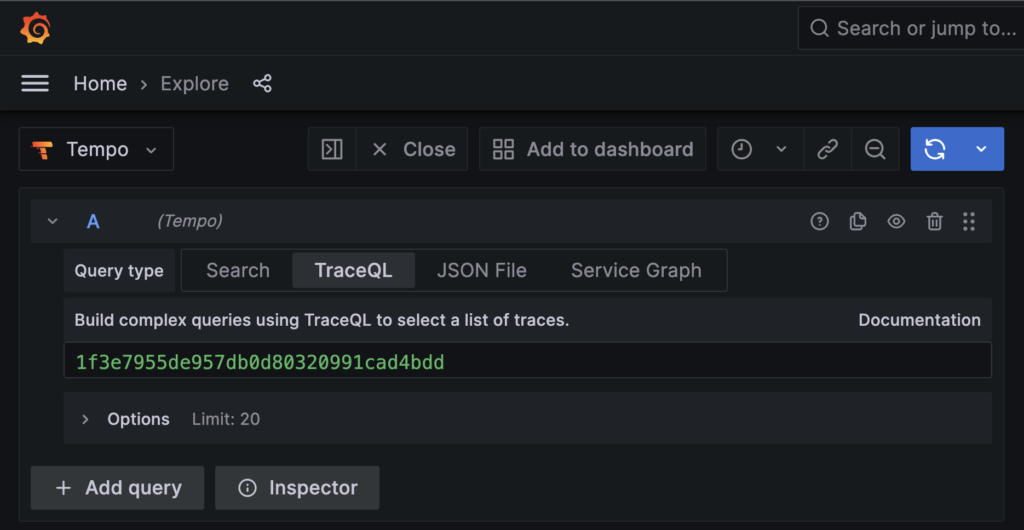
Go to your Grafana data sources and explore Tempo. Paste one of the copied trace IDs and search for it, as shown below. To explore more details, click on the log icon.
Conclusion
In this guide, we walked through how to connect Grafana with LogScale so that you can view and query LogScale data from within Grafana. We covered installing the Falcon LogScale data source plugin — both natively in an operating system and using the Grafana Docker image. We also covered configuration and authentication from Grafana to a LogScale repository with a personal API token. Finally, we demonstrated how to run LogScale queries in Grafana and leverage saved queries for portability.
For many organizations, LogScale may just be one piece of a wider observability strategy that also leverages Grafana for dashboards and visualizations. Integrating LogScale alongside other observability tools is straightforward. For technical details on other aspects of the LogScale data source plugin for Grafana, check out the Grafana Integration documentation.
Additional Resources
- Watch the CrowdCast, “Future Proof Your Observability Strategy with CrowdStrike and Cribl.”
- Read the white paper, “Log Everything to Answer Anything in Real Time” to learn how Falcon LogScale revolutionized log management.
- See how CrowdStrike is driving the convergence of security and observability with Falcon LogScale and Falcon Complete LogScale.
- Get a free trial of Falcon LogScale and see for yourself how you can log everything to answer anything in real time.
- Contact us to learn more about Falcon LogScale.


