How to Speed Investigations with Falcon Forensics

Introduction
Threat hunters and incident responders are under tremendous time pressure to investigate breaches and incidents. While they are collecting and sorting massive quantities of forensic data, fast response is critical to help limit any damage inflected by the adversary. This article and video will provide an overview of Falcon Forensics, and how it streamlines the collection and analysis of point-in-time and historic forensic data.
Video
Deploying Falcon Forensics
To facilitate the collection of Forensics data, CrowdStrike provides dissolvable agents for Windows, Mac and Linux that can be downloaded from the “Host setup and management -> Sensor Downloads” page in the Falcon UI with the “Tool Downloads” link. Those executables can then be deployed via Real Time Response, Falcon Fusion, or other software deployment tools. Once deployed and executed, CrowdStrike Falcon® Forensics collects a snapshot of both forensic and point-in-time triage data from the host.
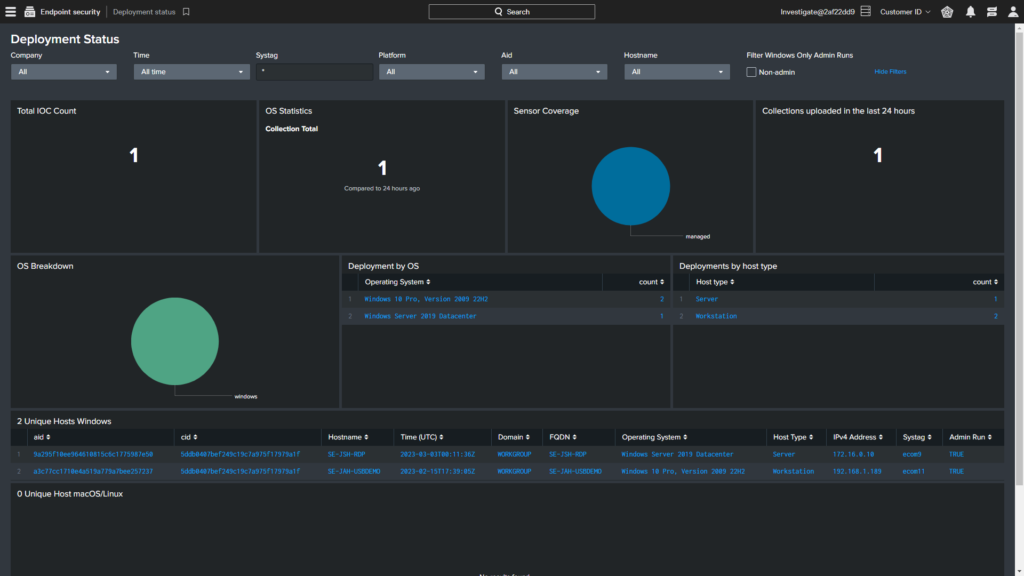
The resulting data is then made available in the cloud. It can be exported via FDR or viewed through the Falcon user interface and a number of pre-configured dashboards. The Deployment Status dashboard highlights how many systems have the tool installed along with the number of collections in the past 24 hours. In addition to breakdowns by operating system and role, the hosts can be filtered by Agent ID and system name.
Analyzing Forensics Data
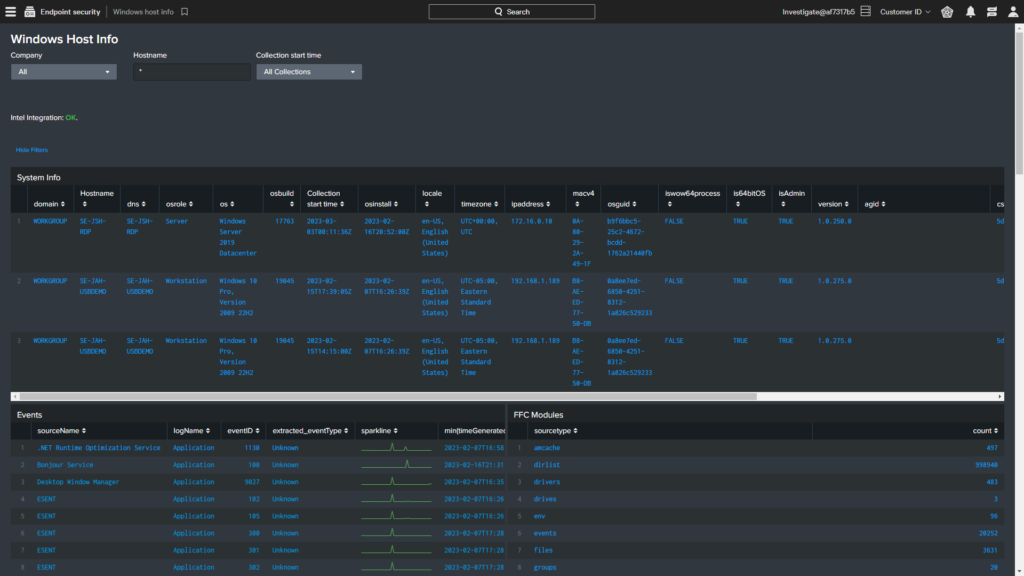
There are two main dashboards available to review the collected Forensics data. On the Host Info page, there are options to search by hostname and collection time. The dashboard provides a summary of events by source name as well as a count of Falcon Forensics Modules by source type. Integration with Falcon Intelligence allows for the viewing of IoC and threat types, as well as confidence levels and custom severity.
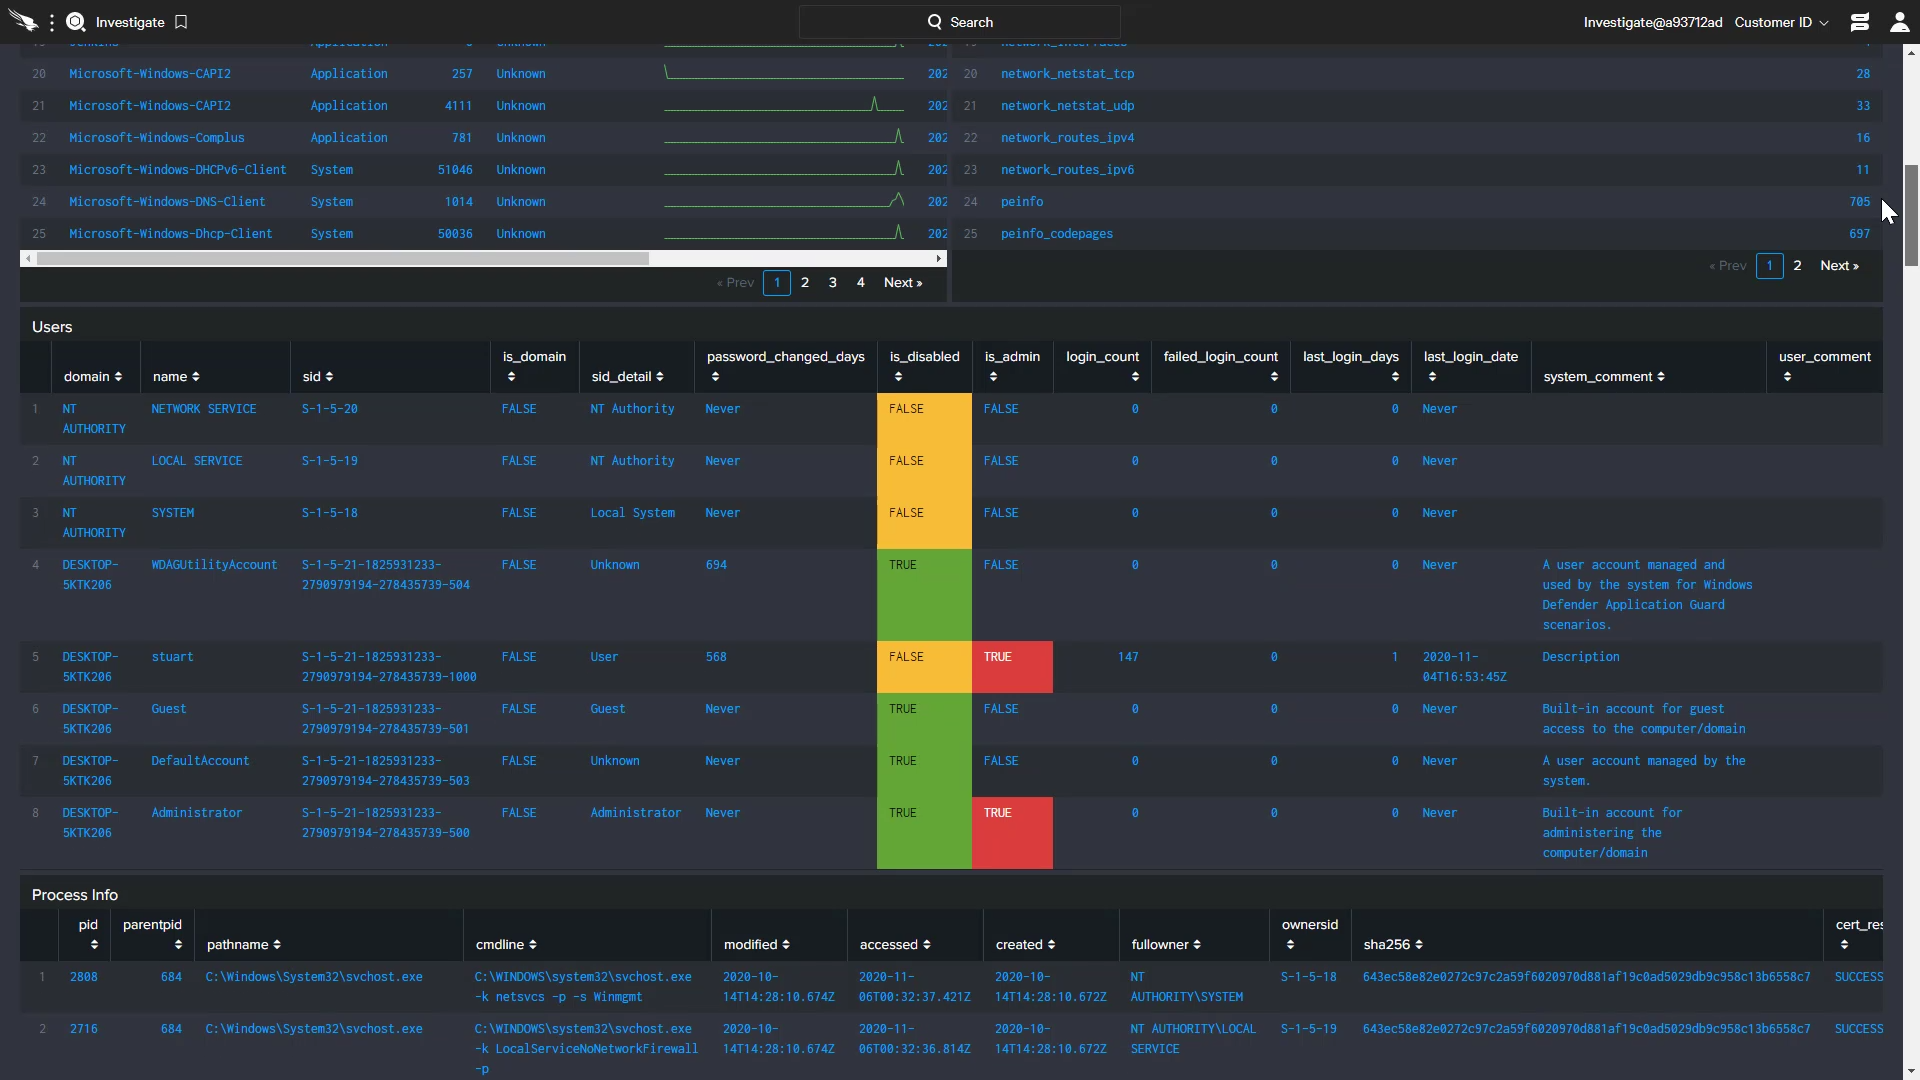
The Users information highlights potential areas of concern around account status, and admin privileges as well as failed login attempts. This page also includes details on process information, network processes, network interfaces and shim cache.
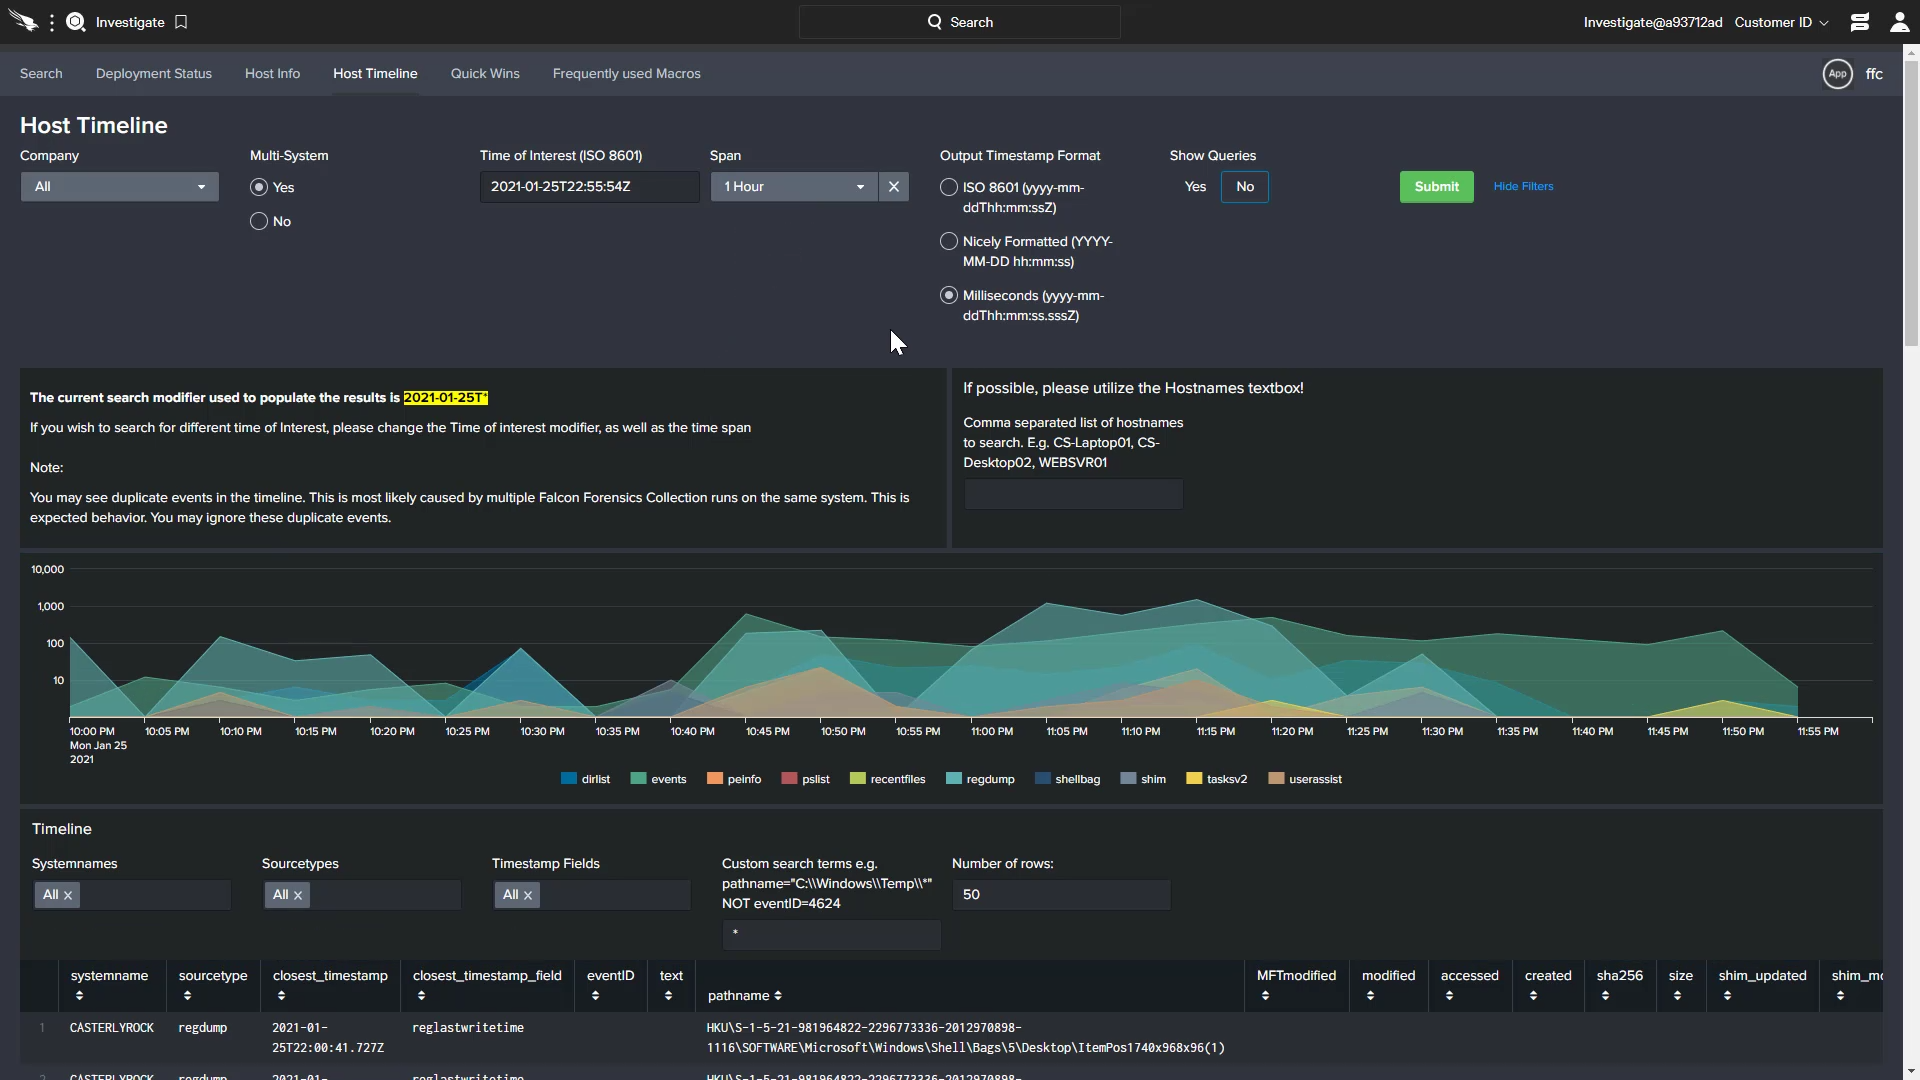
The Host Timeline report can be used to look at a specific host or a multi system view over a defined period of time. The event types are color coded with the option to focus on them individually. Highlighting a specific section of the timeline filters the support list to show only events during that window of time. Those events can also be further filtered by system name and source type as well as time and custom fields.
Windows Hunting Leads with Forensics
In addition to host based and custom searches, Falcon Forensics also includes a dashboard for hunting leads for Windows. By providing a list of panel groups, this feature helps organizations identify activity with a higher signal-to-noise ratio. It offers low-hanging fruit for analysts to quickly identify potential misconfigurations or hacker activity.
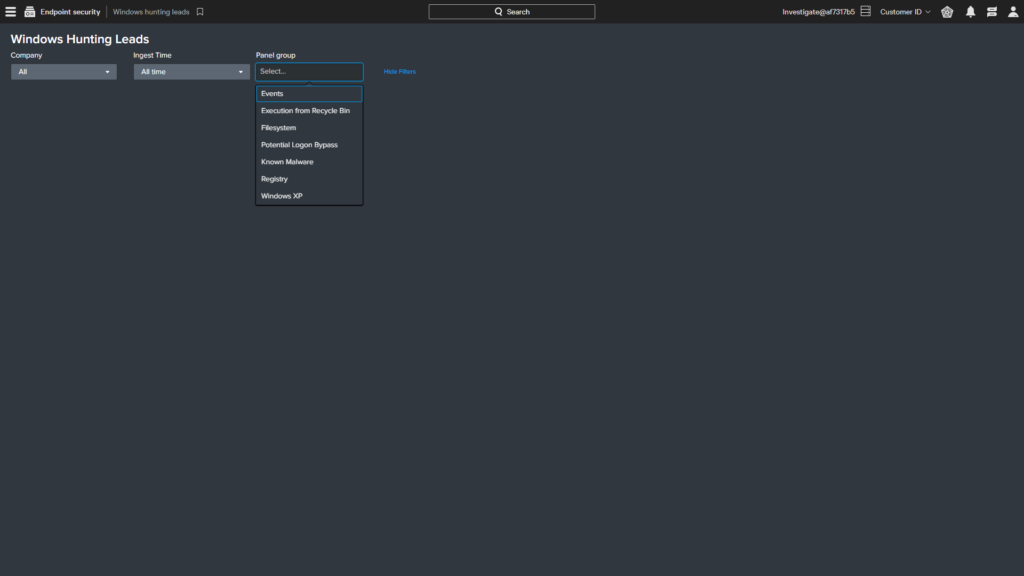
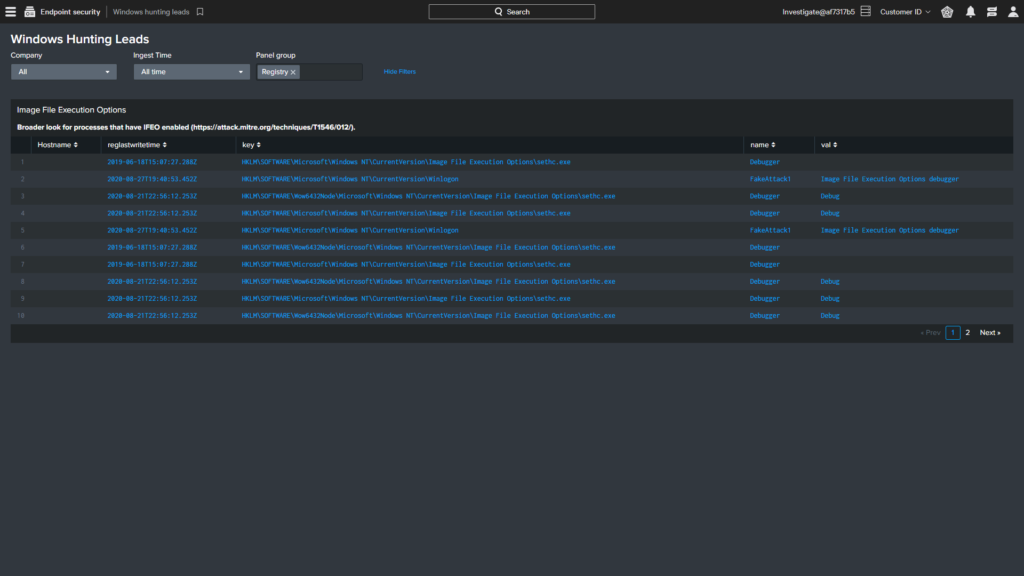
This example uses the registry to report a list of processes that could be victim to a specific MITRE technique related to Image File Execution Options. These quick win reports give analysts easy access to drill in on specific, potential misconfigurations or attacker driven activity.
Conclusion
Falcon Forensics streamlines the collection of point-in-time and historic forensic triage data for robust analysis of cybersecurity incidents. With predefined dashboards and flexible search options, responders can quickly identify relevant data and speed investigations.
